Arduino temp logger and gnuplot
2 minute read
Simple Arduino temp logger and gnuplot examples
I wanted to do some temperature logging across day and night to see how much temperature fluctuates for beer brewing/storage. I thought this would be a good little Arduino project.
Arduino source code: bitbucket.org/2E0PGS/dht-sd-logger
gnuplot
gnuplot> set datafile separator "," # This is a comma separated CSV.
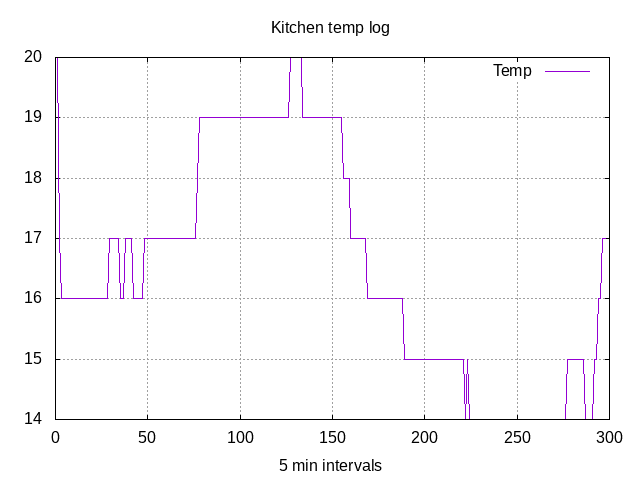
gnuplot> set title 'Kitchen temp log' # Add graph title.
gnuplot> set grid # Turn on the grid.
gnuplot> set key autotitle columnhead # Use first row for line key.
gnuplot> set xlabel '5 min intervals' # Set x axis label.
gnuplot> plot '2021-02-15-kitchen.csv' using 0:2 with lines # Plot that second column with line graph.
In my case the csv line number is being used for x axis and I log every 5 mins a new line.
gnuplot> set term png                                           # Set output to png file.
gnuplot> set output '2021-02-15-kitchen.png'                    # Set output file name.
gnuplot> plot '2021-02-15-kitchen.csv' using 0:2 with lines     # Plot that second column with line graph.
2021-02-15-kitchen.csv
Sample of the Ardunio temp logger CSV data, abbreviated for brevity.
Humidity, Temp, Heat index
18,20,73.13
18,20,73.13
18,17,72.1
18,16,71.95
19,16,72.59
19,16,72.59
18,16,71.95
18,16,71.95
19,16,72.59
19,16,72.59
19,16,72.59
19,16,72.59
19,16,72.59
19,16,72.59
19,16,72.59
19,16,72.59
19,16,72.59
...
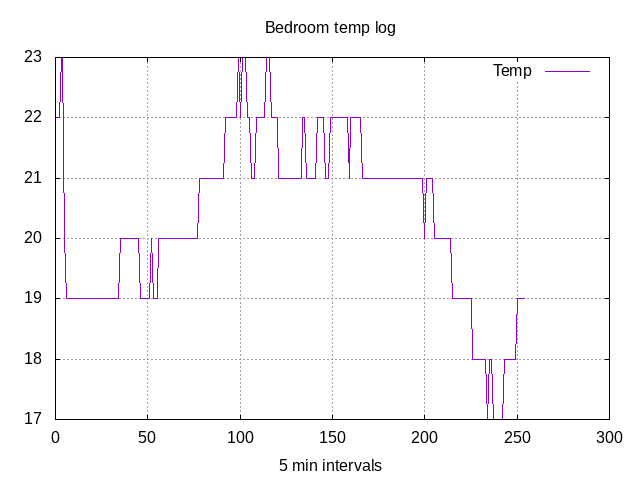
Extra line smoothing options and points
See great example of various smoothing options: stackoverflow.com/questions/30580471/smooth-peaks-in-gnuplot
plot '2021-02-13-bedroom-floor-day-night-morning.csv' using 0:2 smooth acsplines,\
'' u 0:2 w p pt 1 title 'data points'

plot '2021-02-13-bedroom-floor-day-night-morning.csv' using 0:2 smooth mcsplines,\
'' u 0:2 w p pt 1 title 'data points'

plot '2021-02-13-bedroom-floor-day-night-morning.csv' using 0:2 with lines,\
'' u 0:2 w p pt 1 title 'data points'

plot '2021-02-13-bedroom-floor-day-night-morning.csv' using 0:2 with lines,\
'' using 0:2 with points pt 1 title 'data points'

plot '2021-02-13-bedroom-floor-day-night-morning.csv' using 0:2 smooth csplines,\
'' u 0:2 w p pt 1 title 'data points'
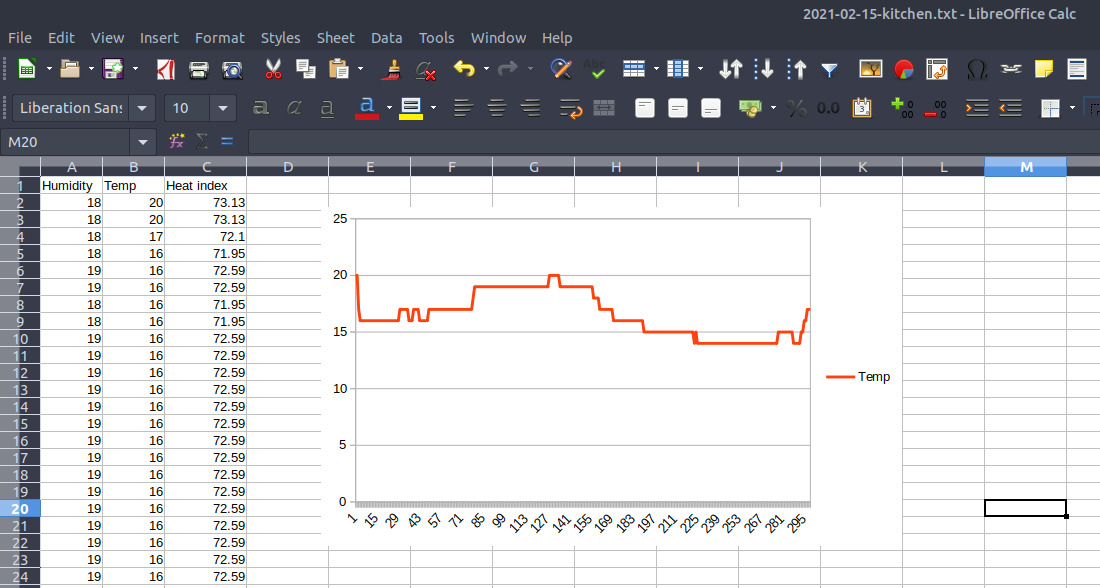
Extra graphing
I wish LibreOffice Calc ctrl + a did a select on only the rows/columns adjacent like Microsoft Excel does instead of selecting the entire sheet.
Below is the same kitchen data set but graphed using LibreOffice line graphs.
I feedback.
Let me know what you think of this article on twitter @M3PGS or leave a comment below!
Let me know what you think of this article on twitter @M3PGS or leave a comment below!
comments powered by Disqus